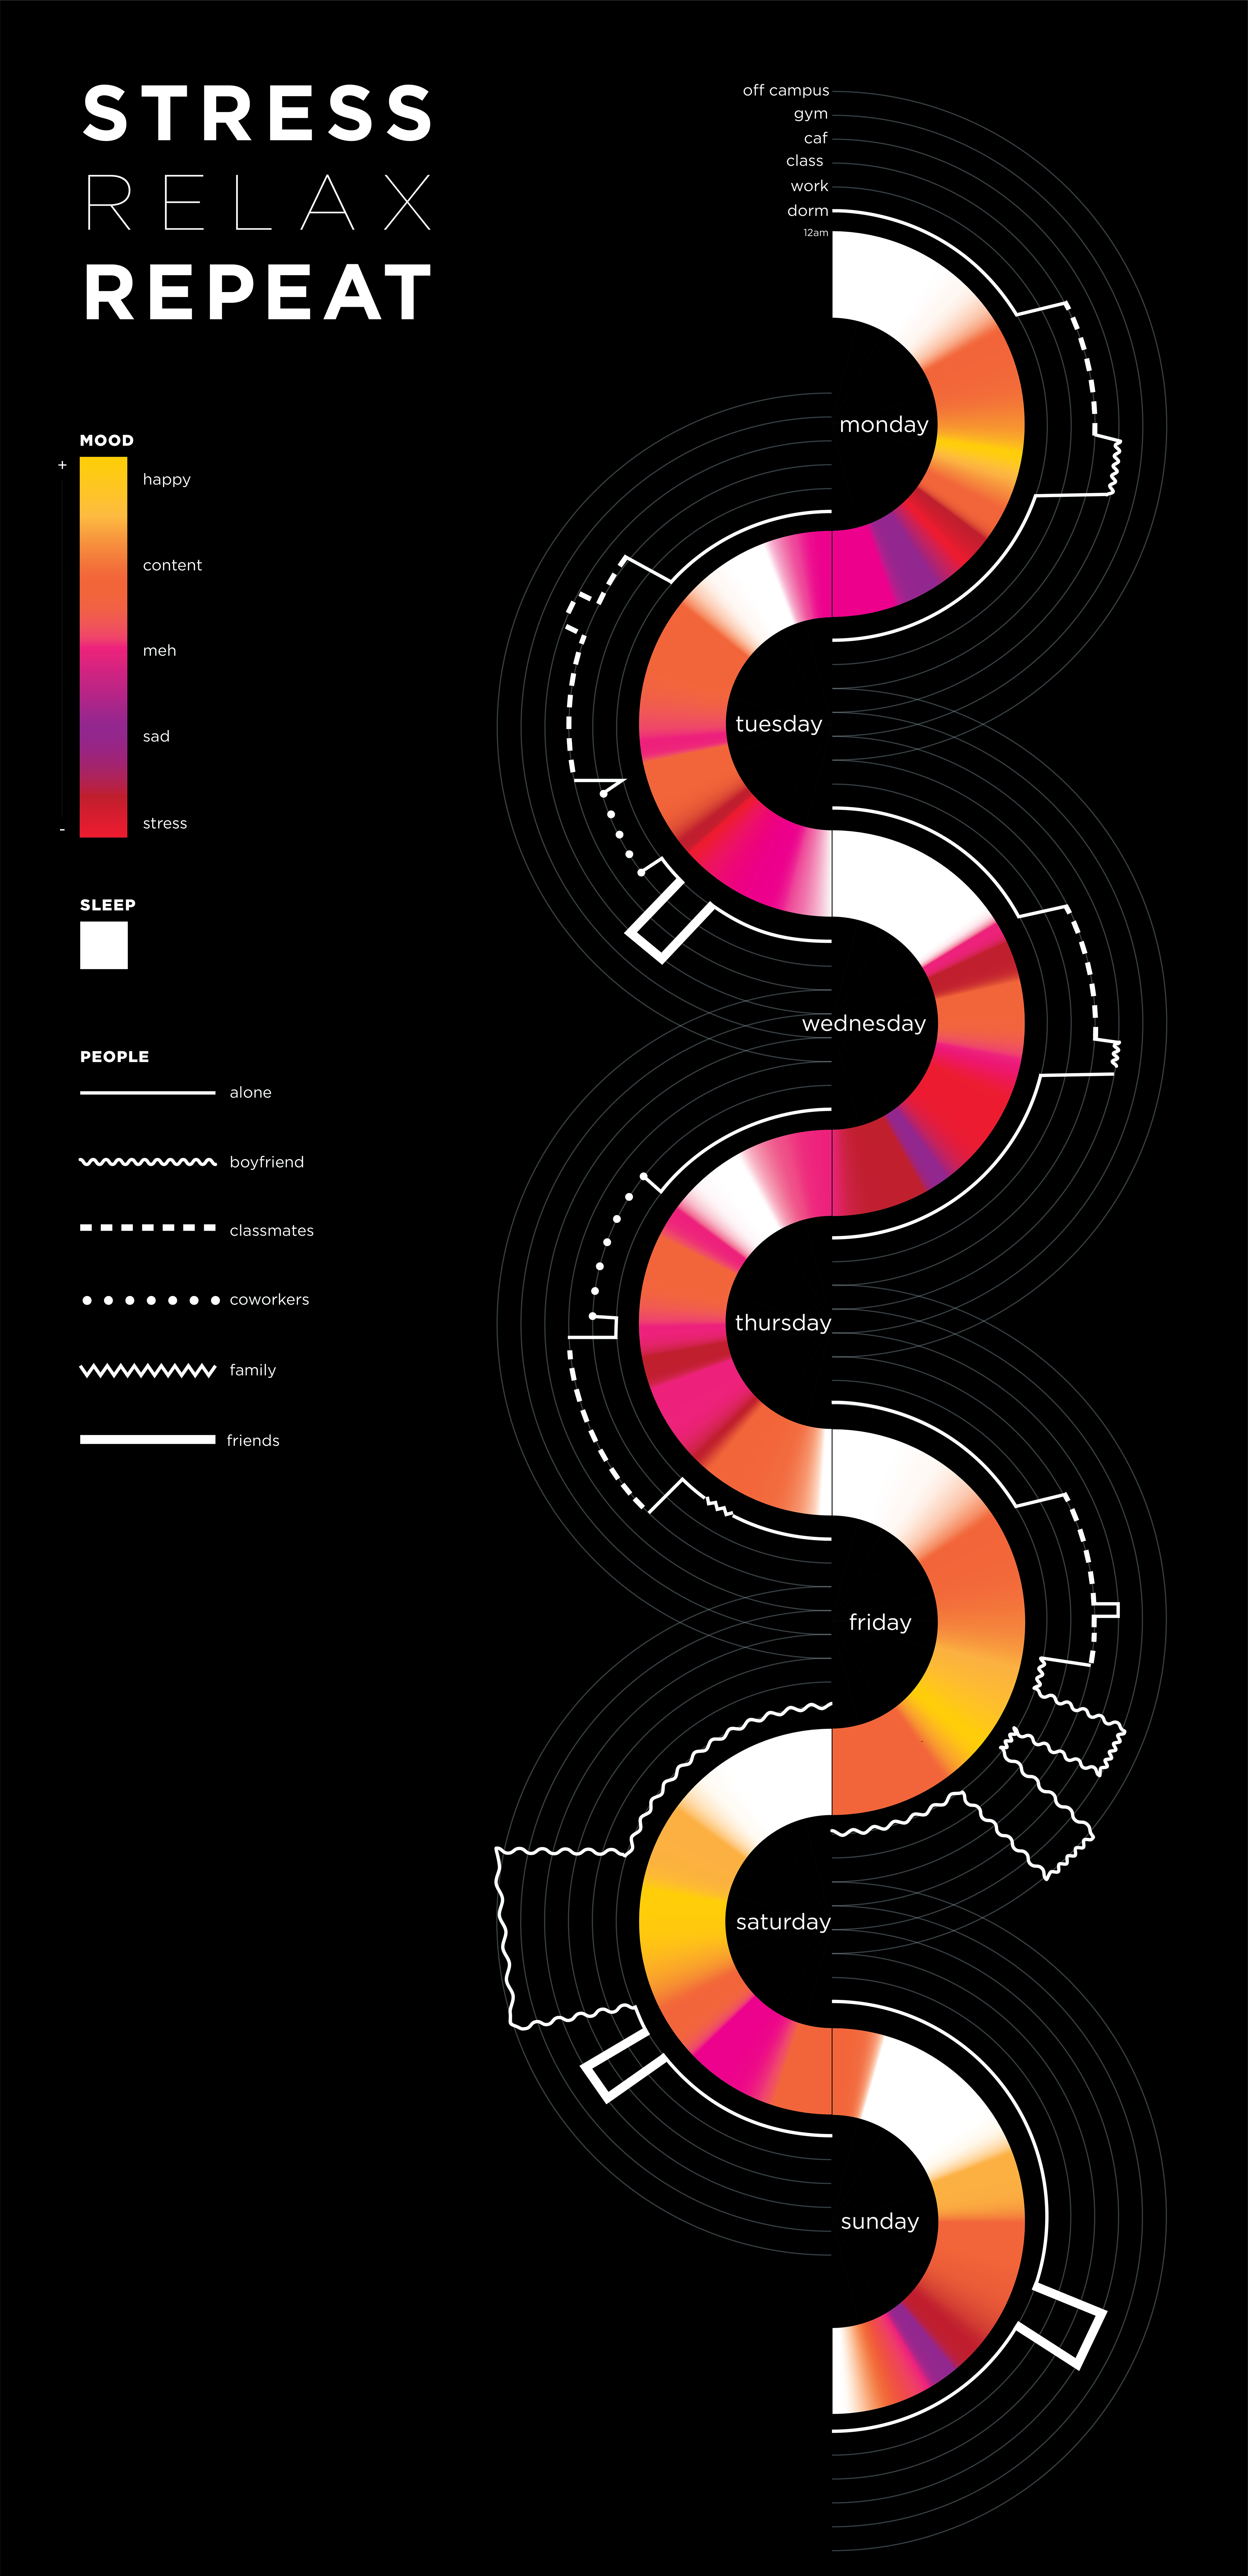
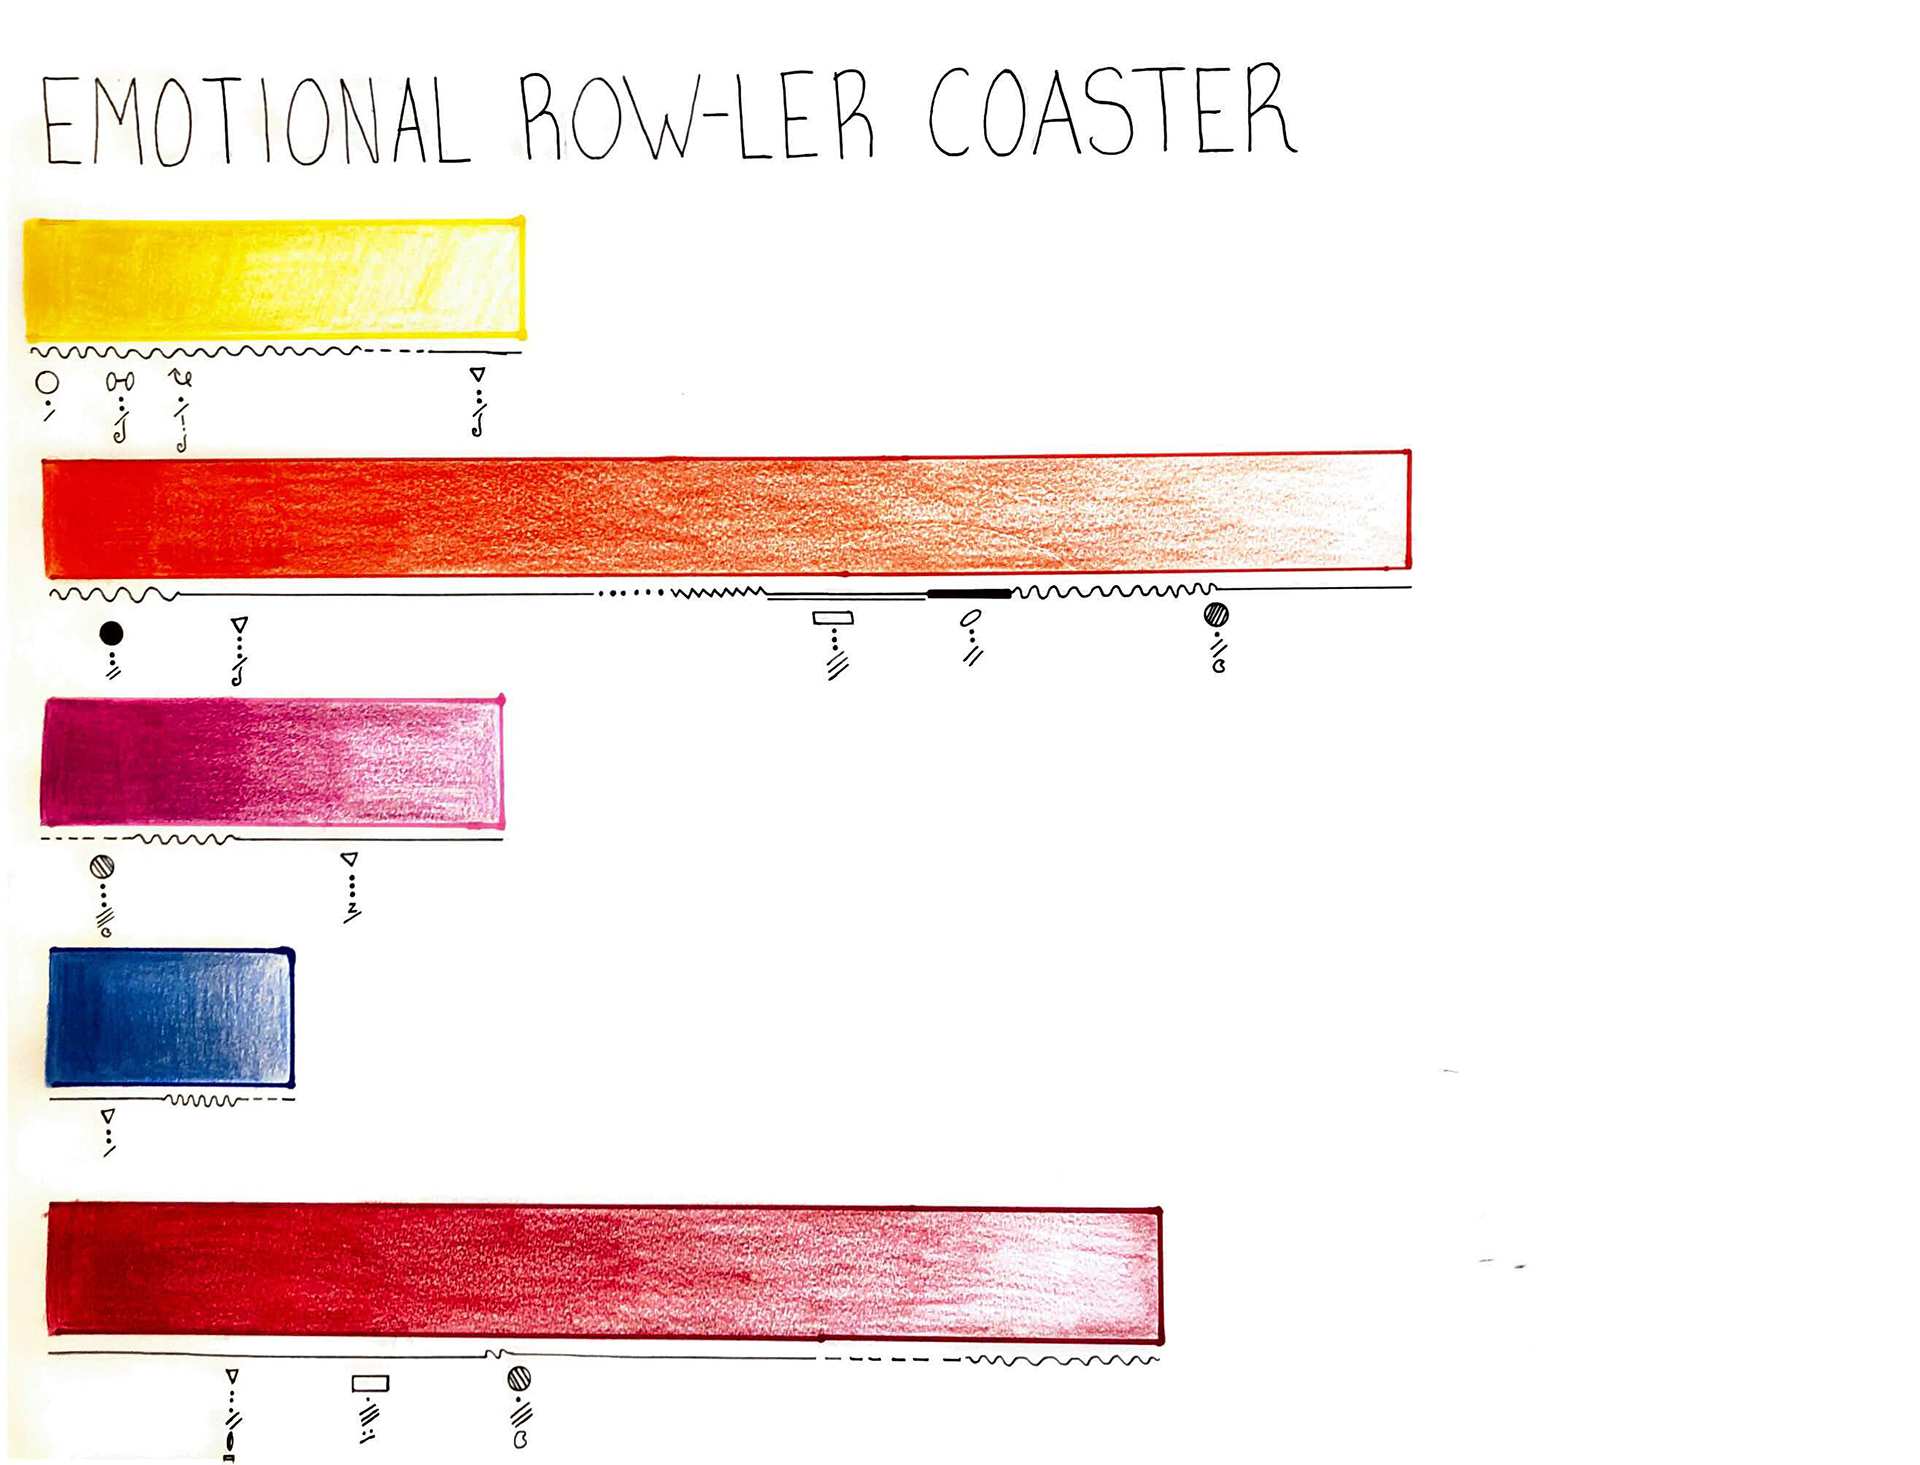
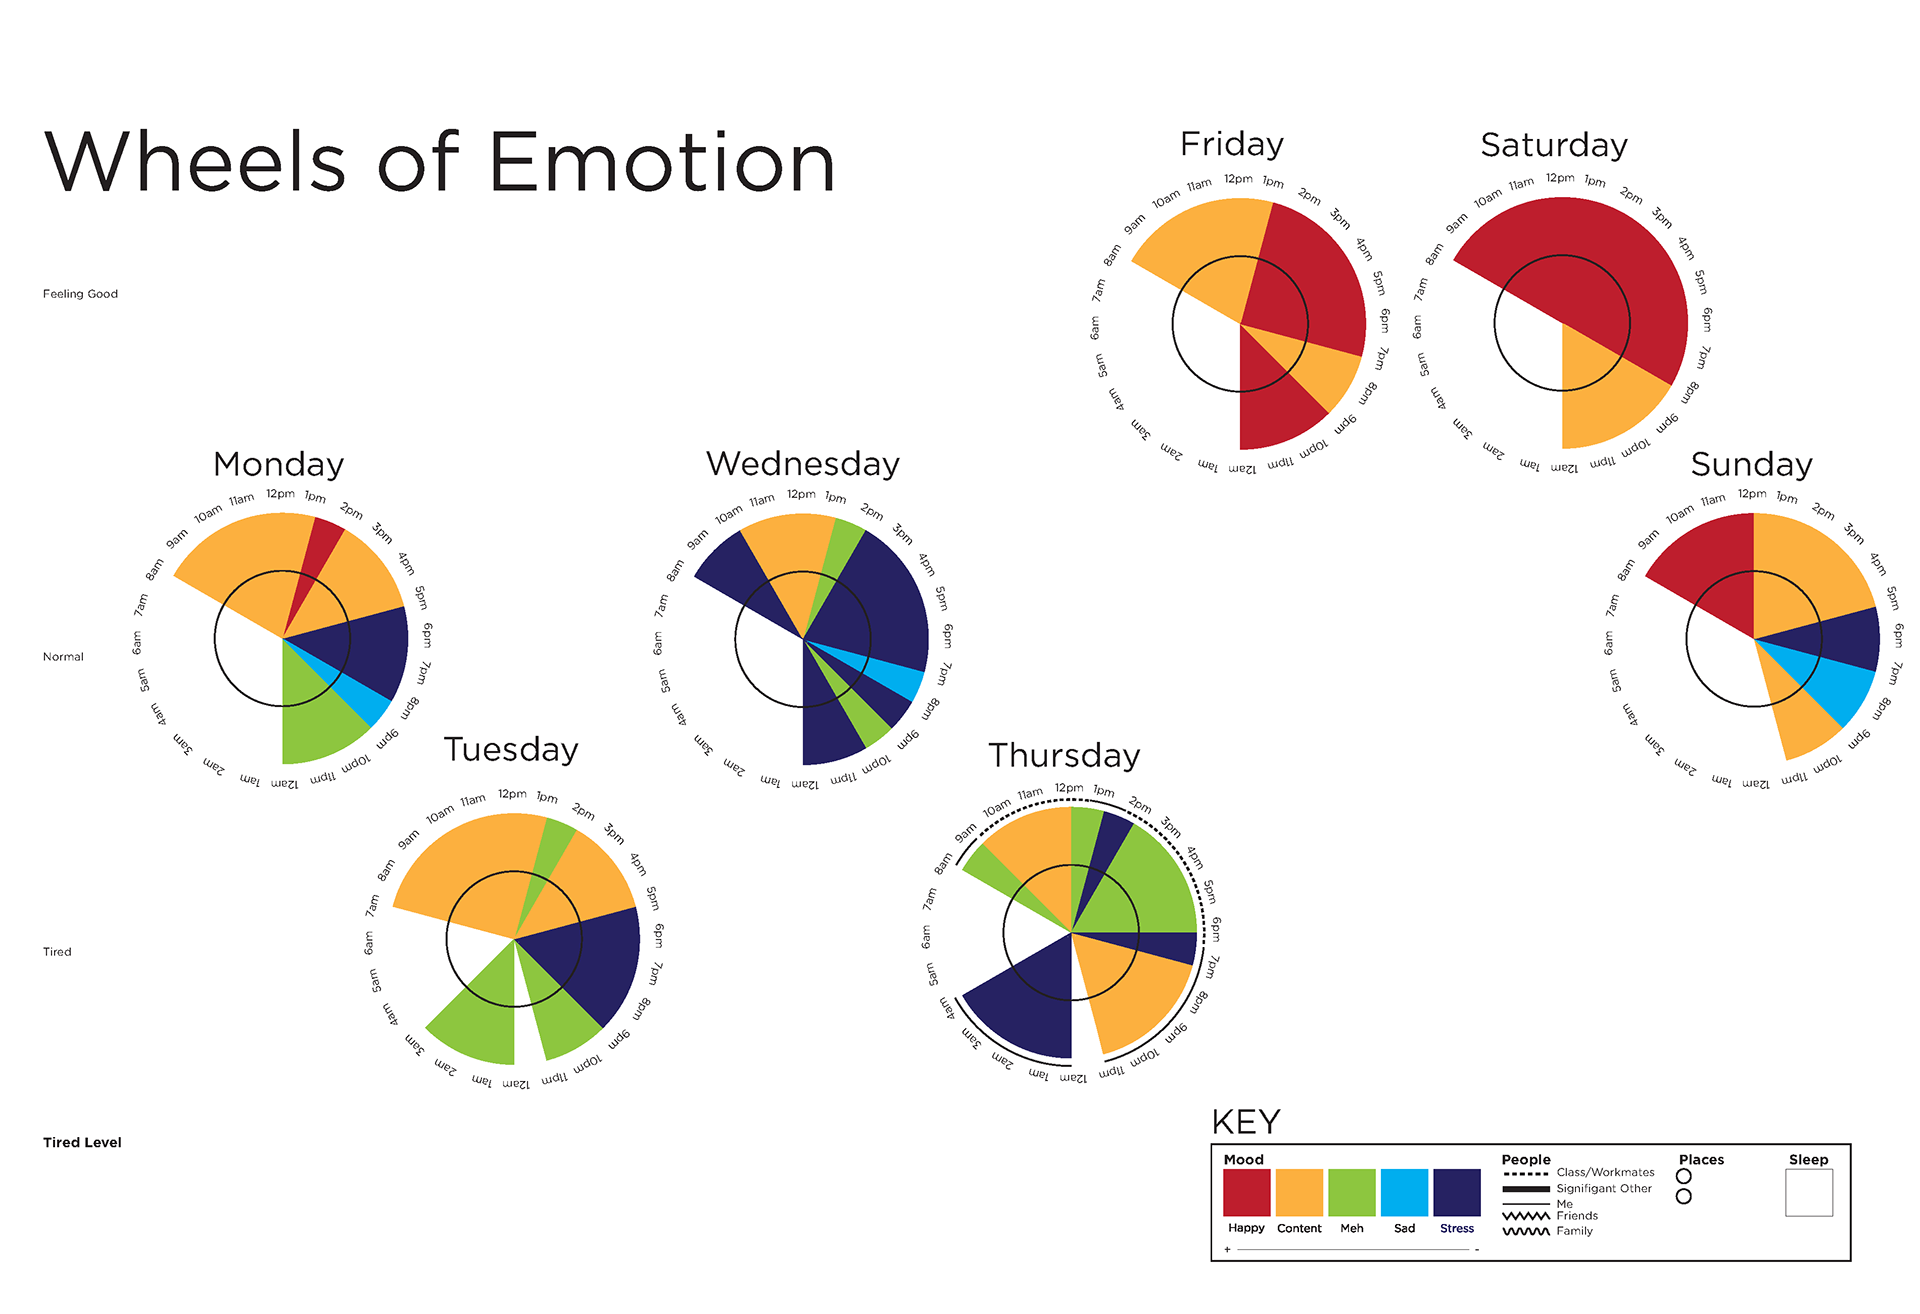
Over the course of 3 weeks we were asked to collect personal data and create a story about our week. I centered my data visualization around my mood. Each mood was given a color based on its feeling. I additionally tracked where I was, who I was with, and the amount I slept, which is shown in white on the mood bar. Each location is listed in geographical order from my dorm and is represented by lines that radiate out from each day.
PROCESS — Week One: Data Drawing
For 7 days, we recorded as much data as we could about our life. We began recording this data through drawings before moving to Data Mapping in digital.
PROCESS — Week Two: Data Drawing
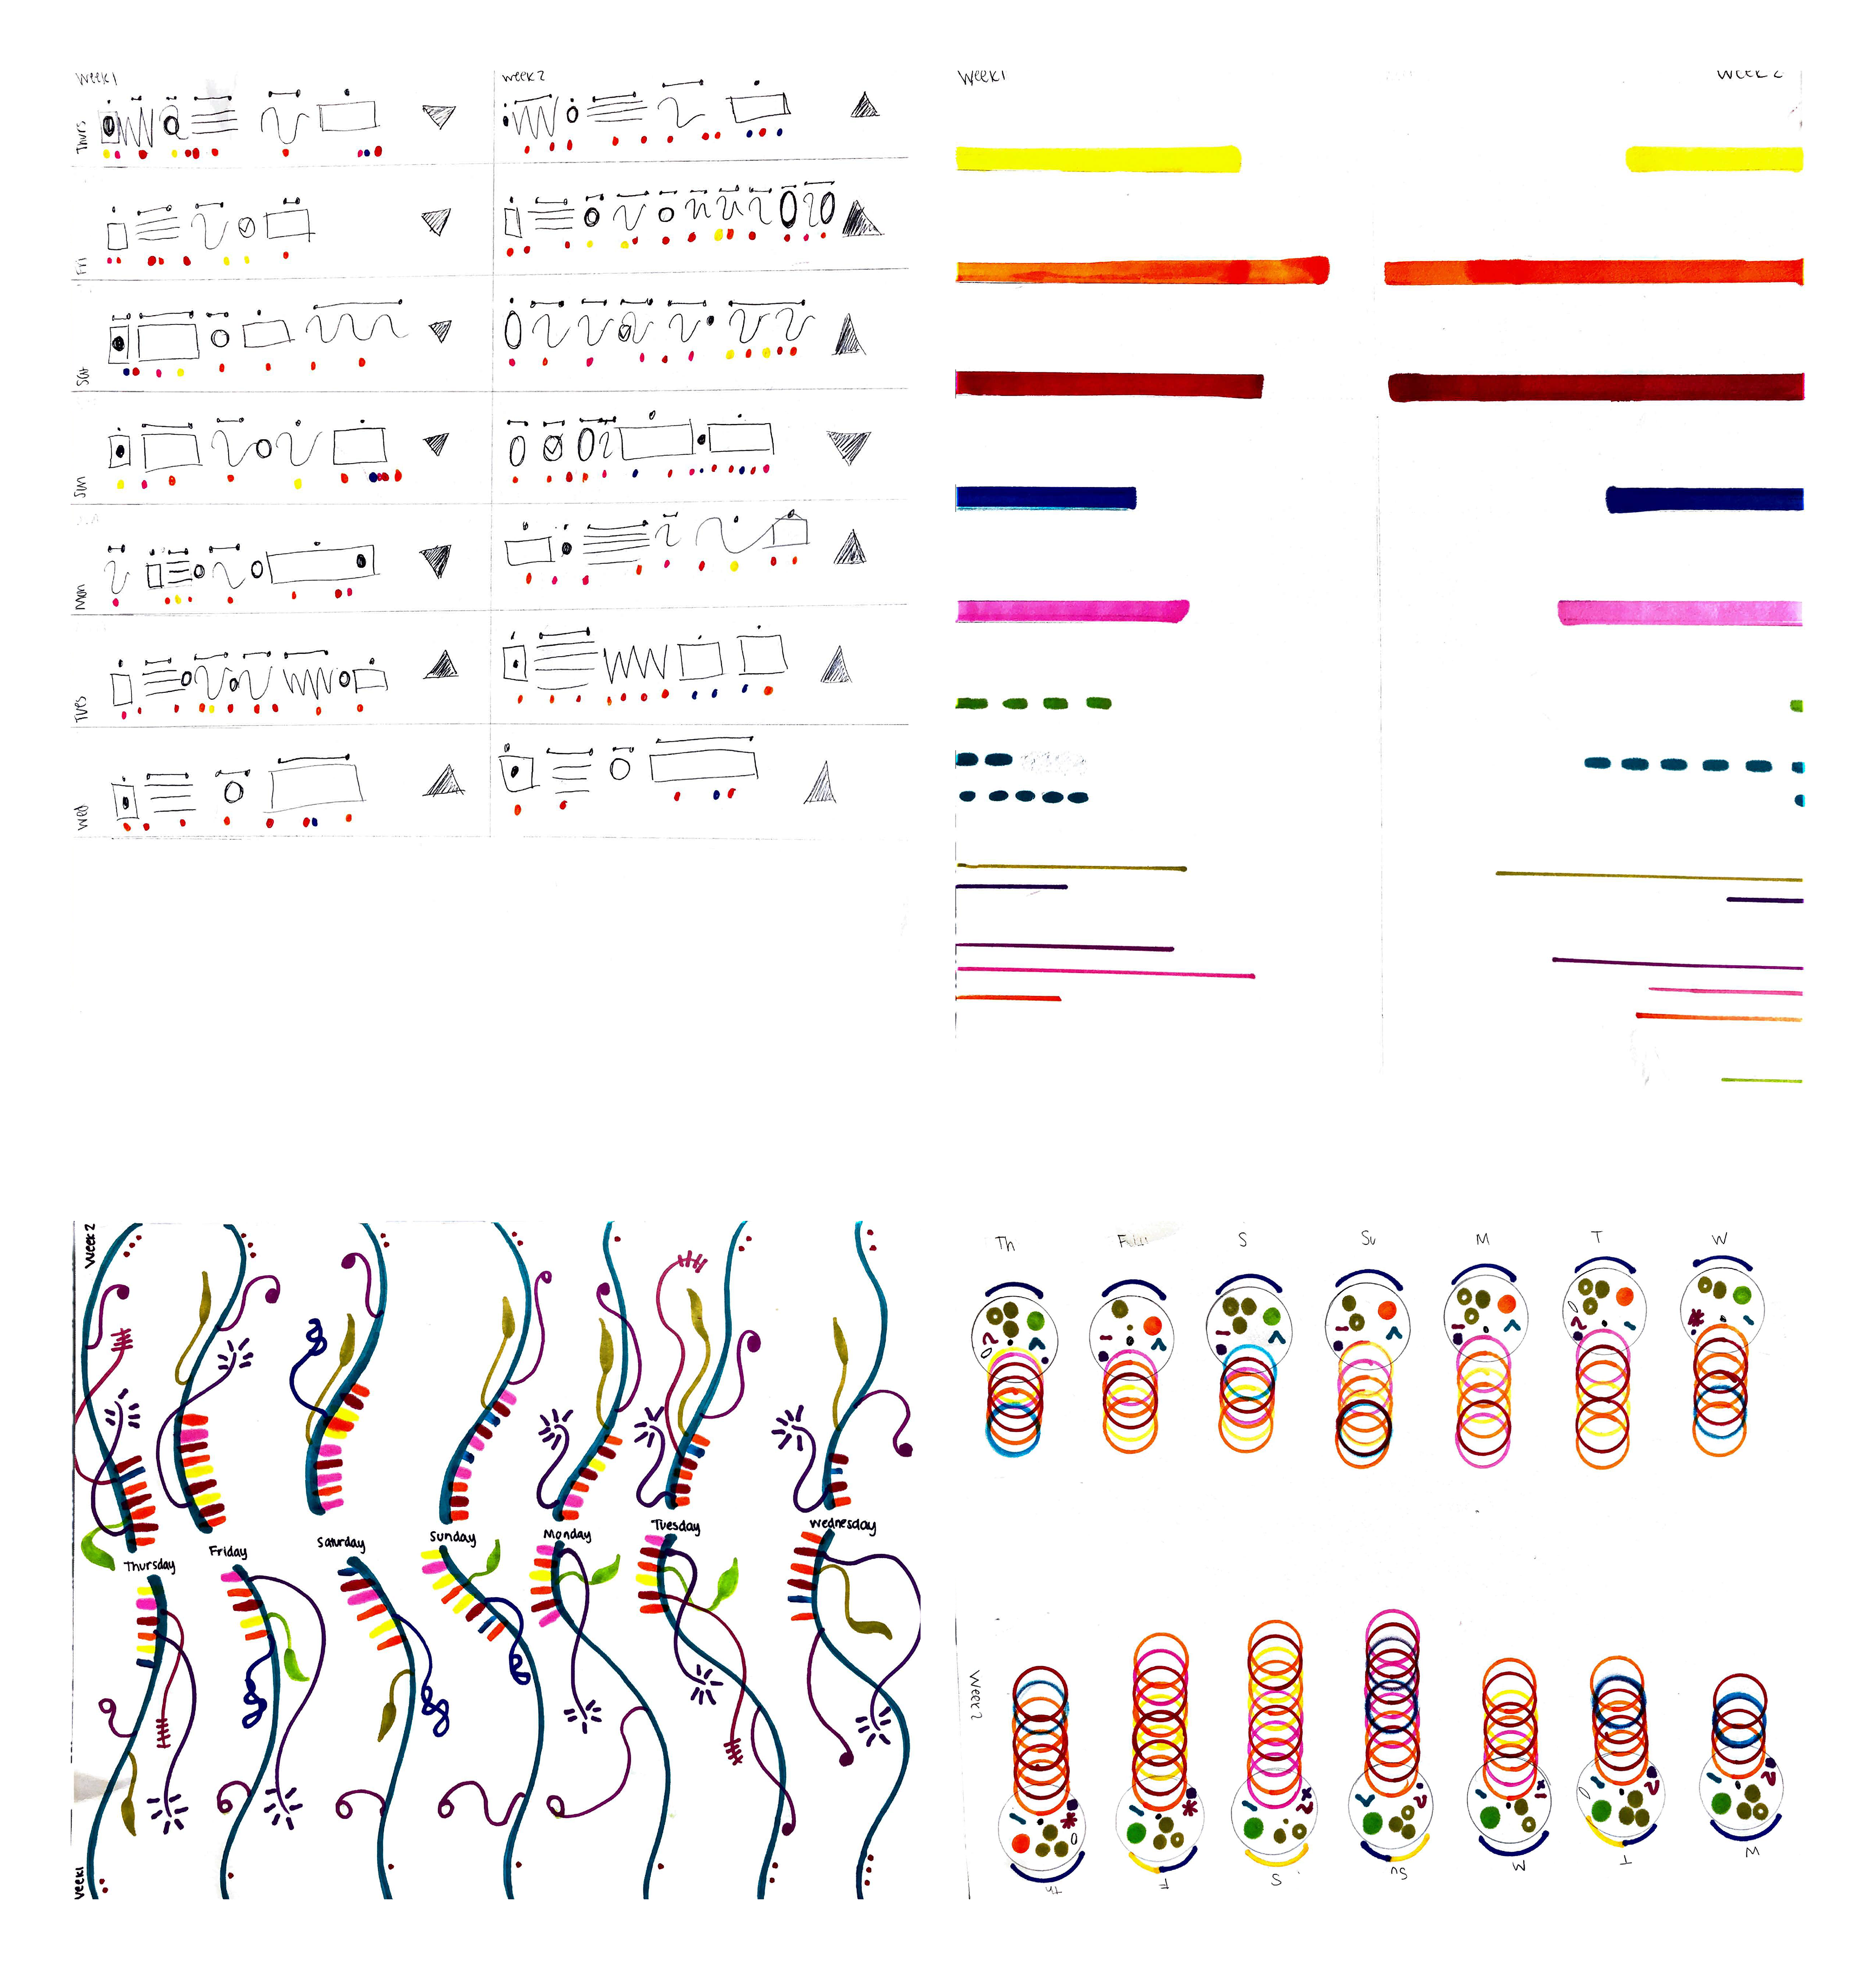
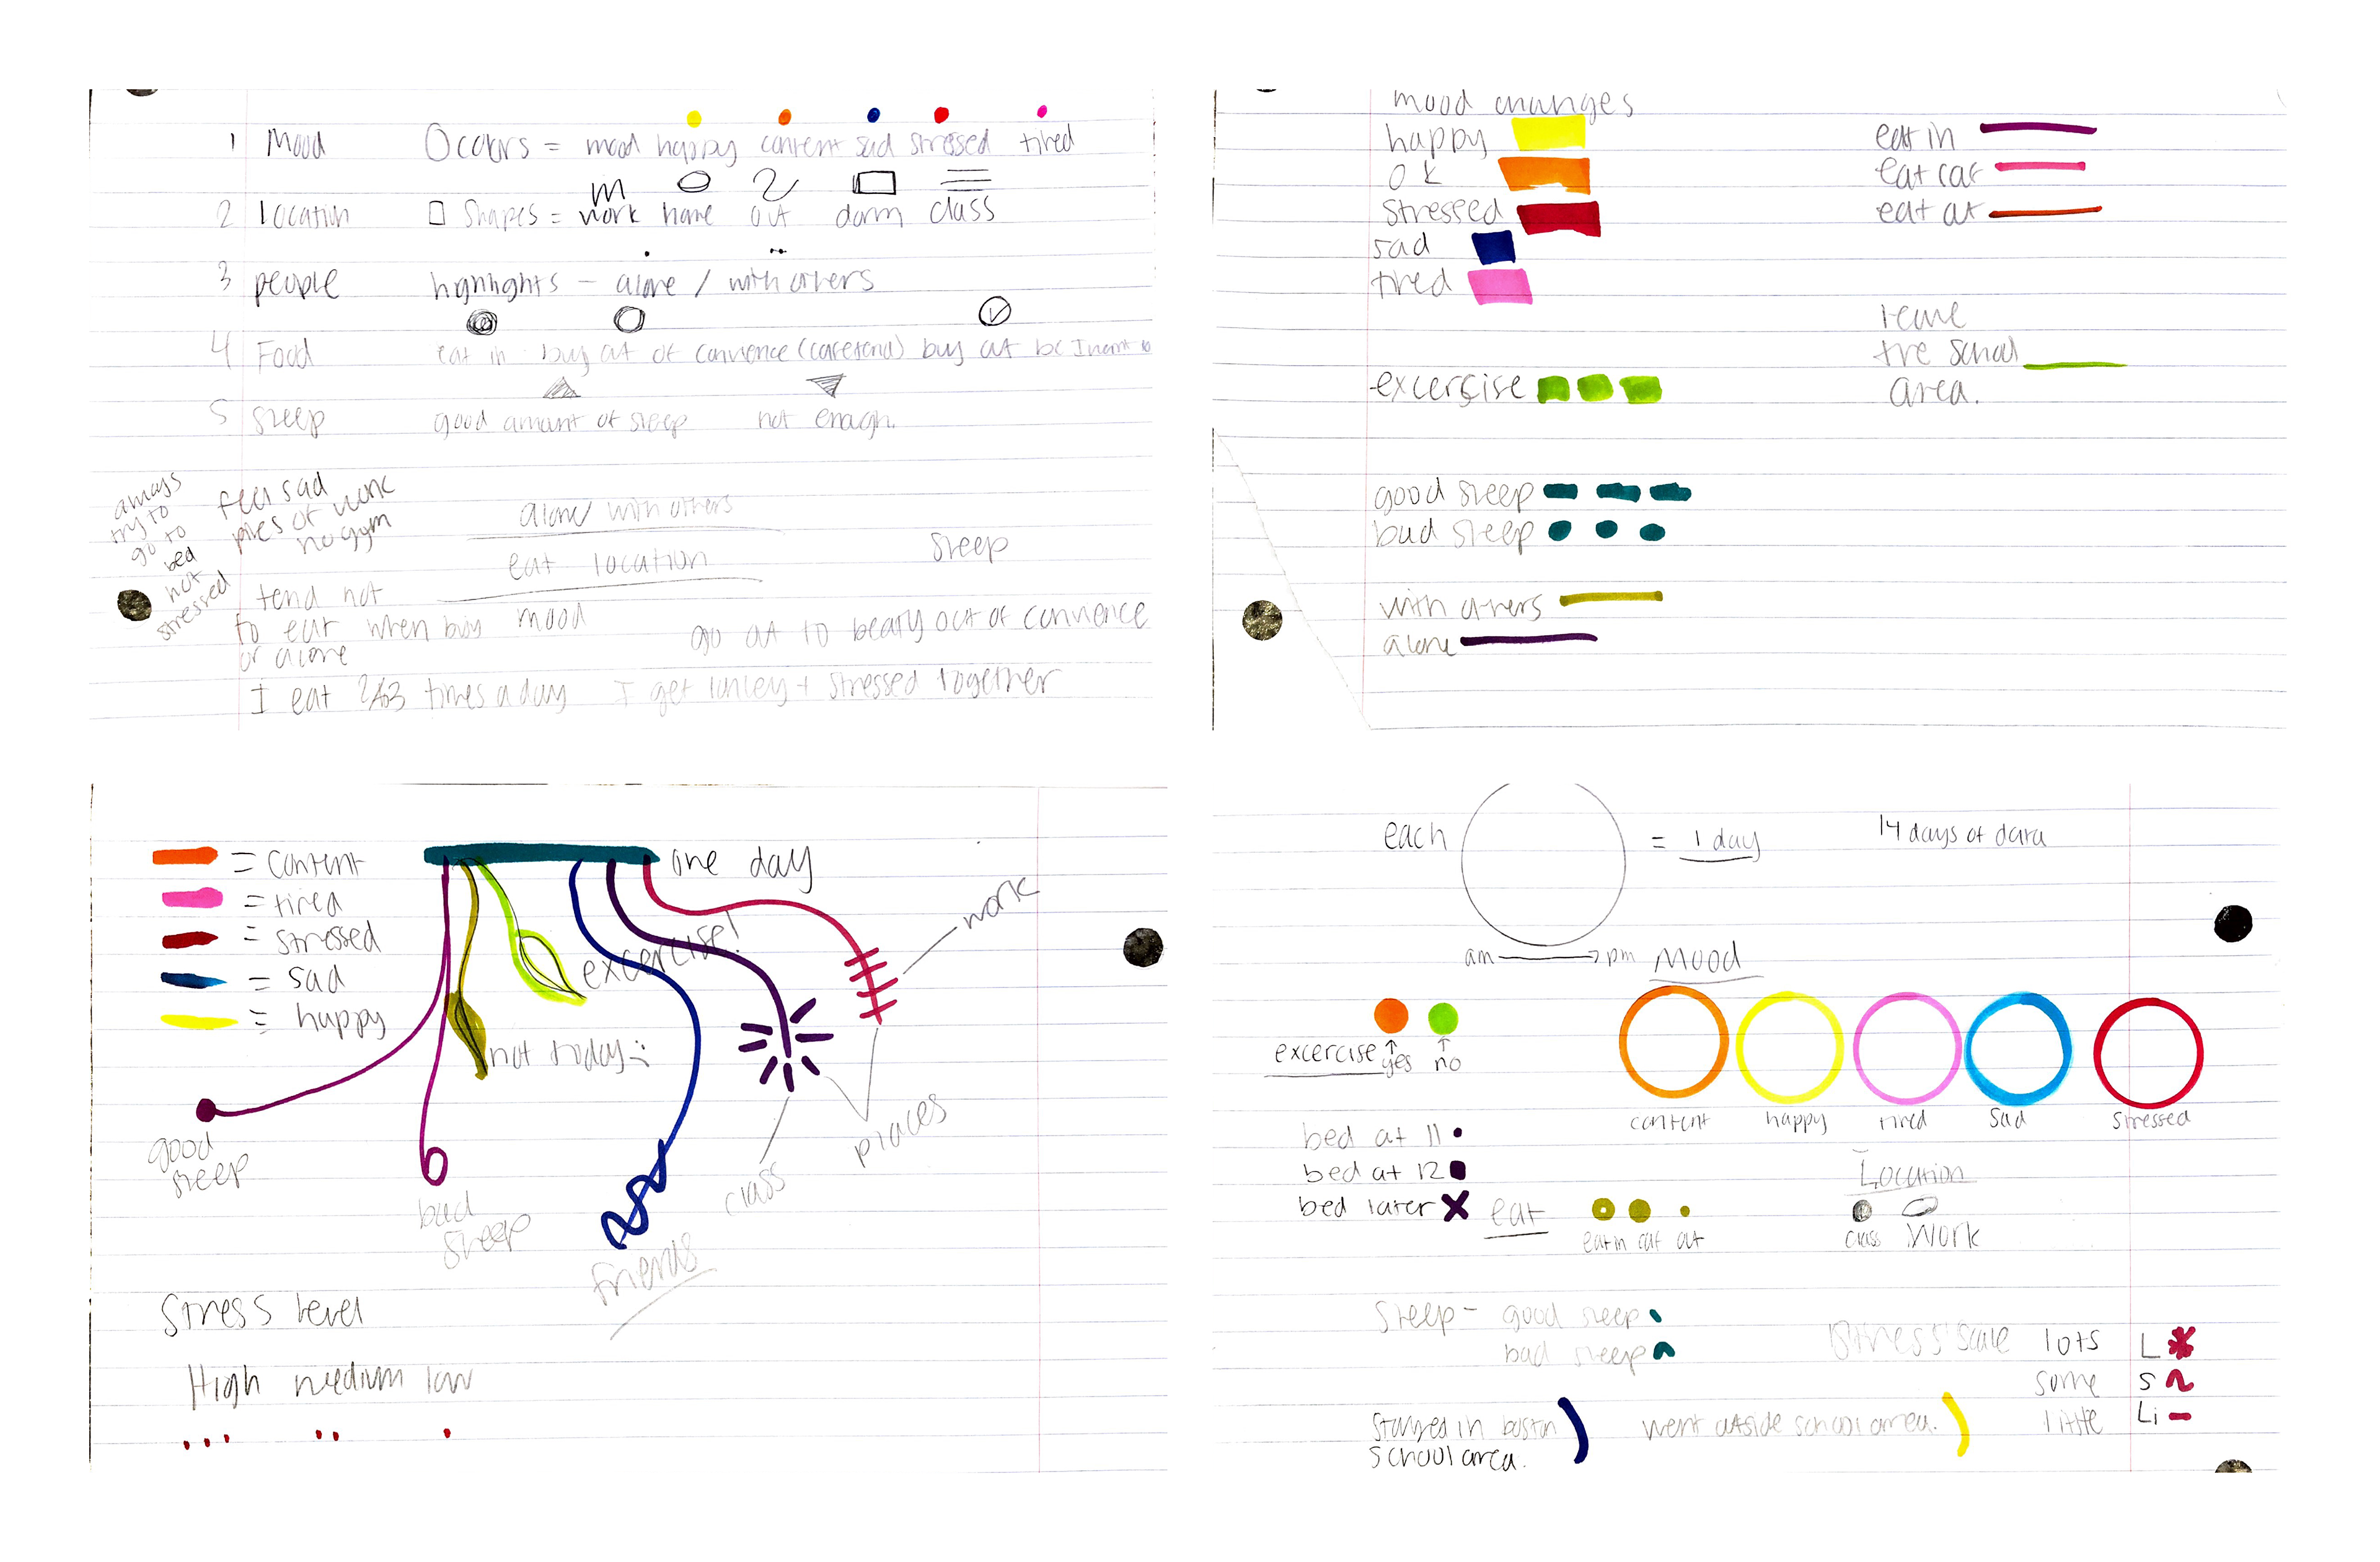
Keys
PROCESS — Week Three: Data Drawing
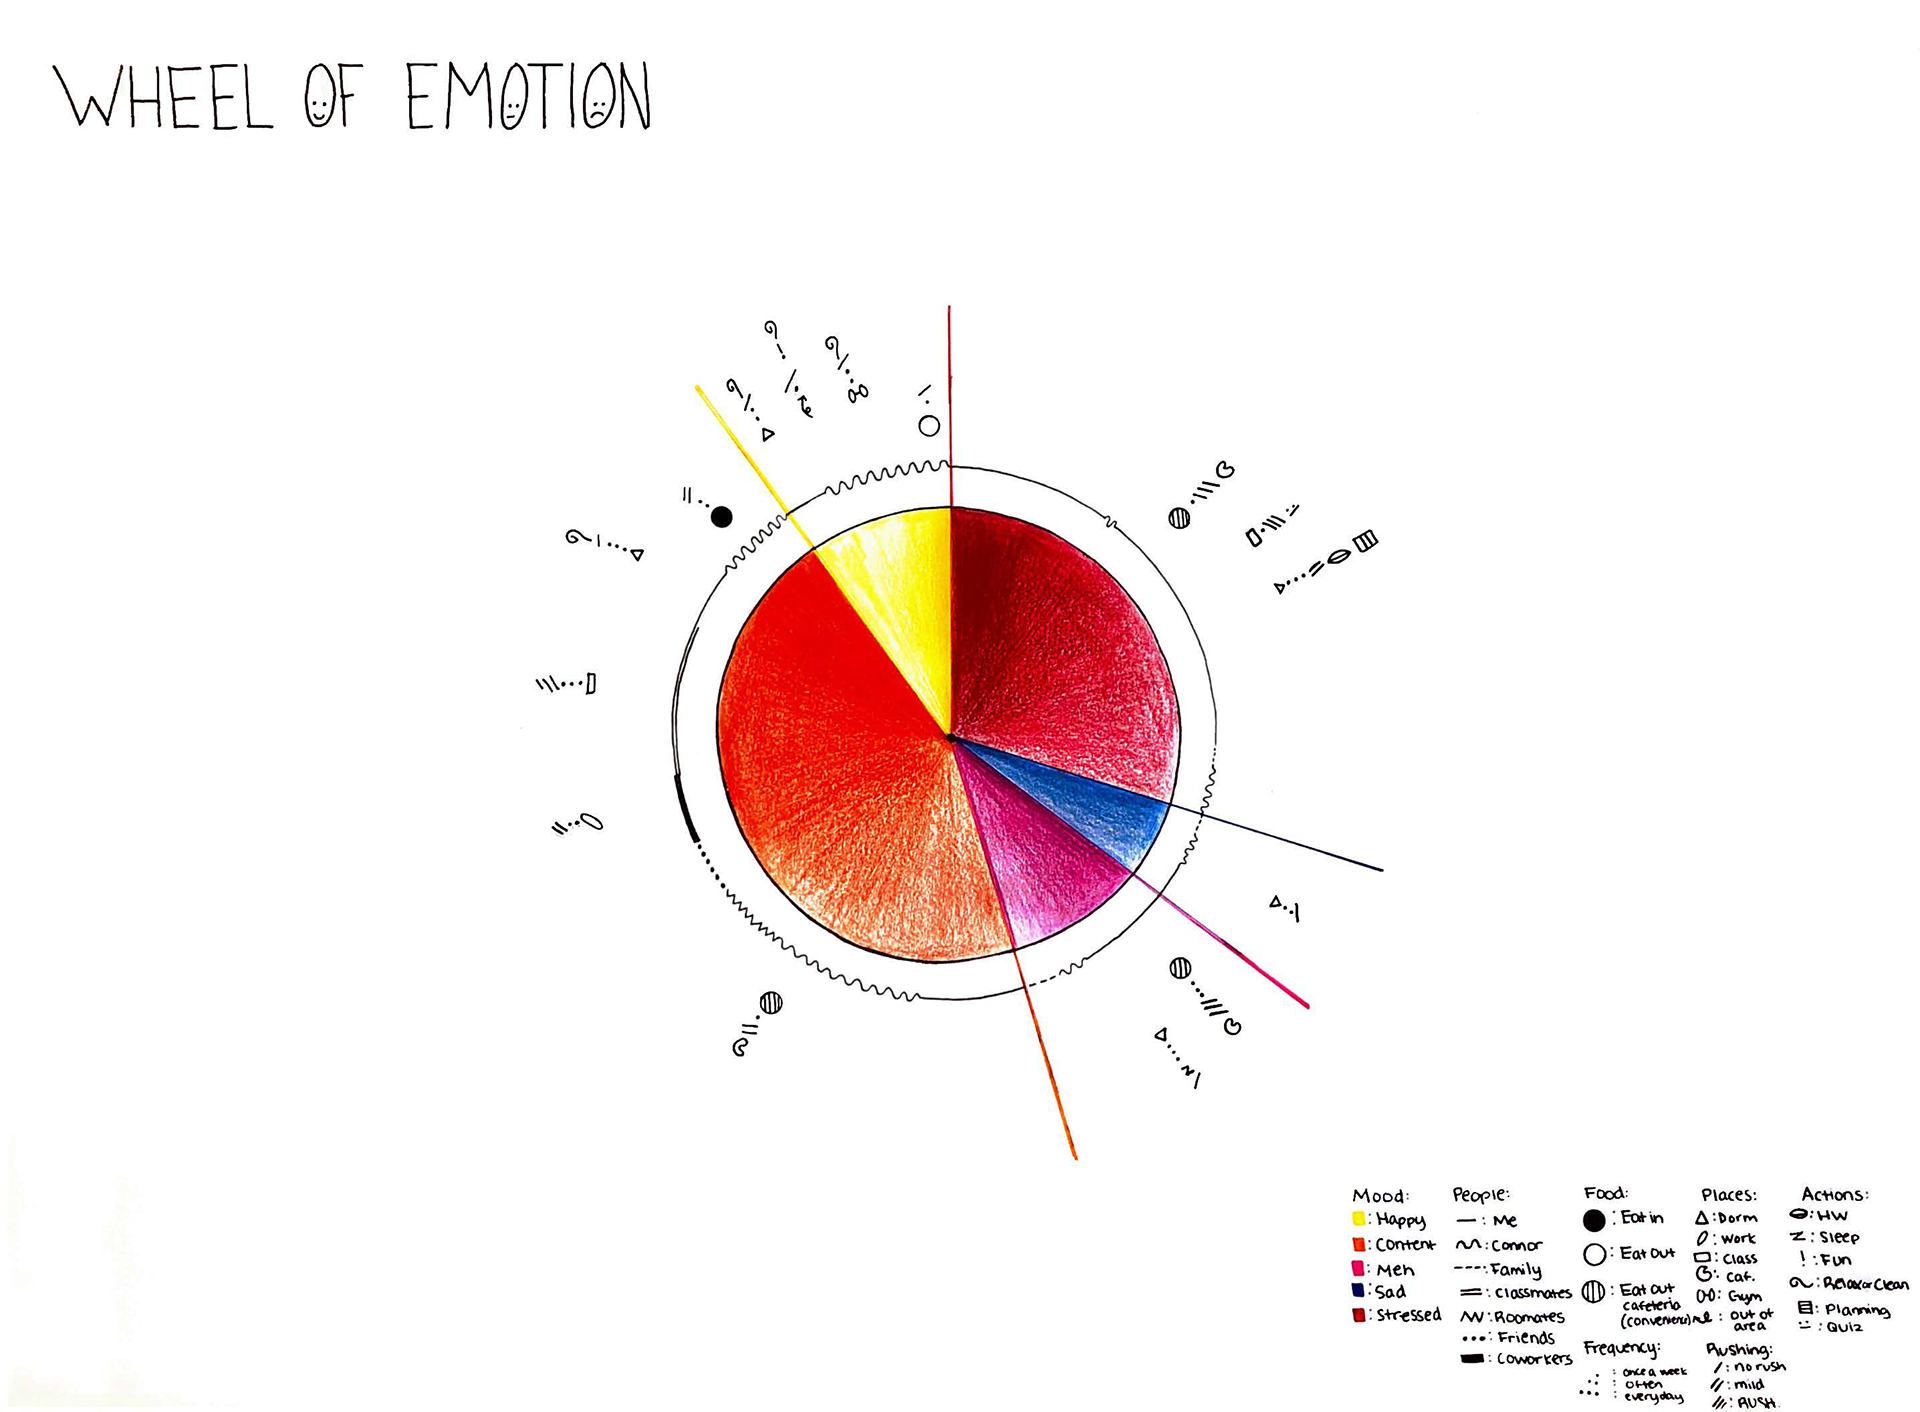
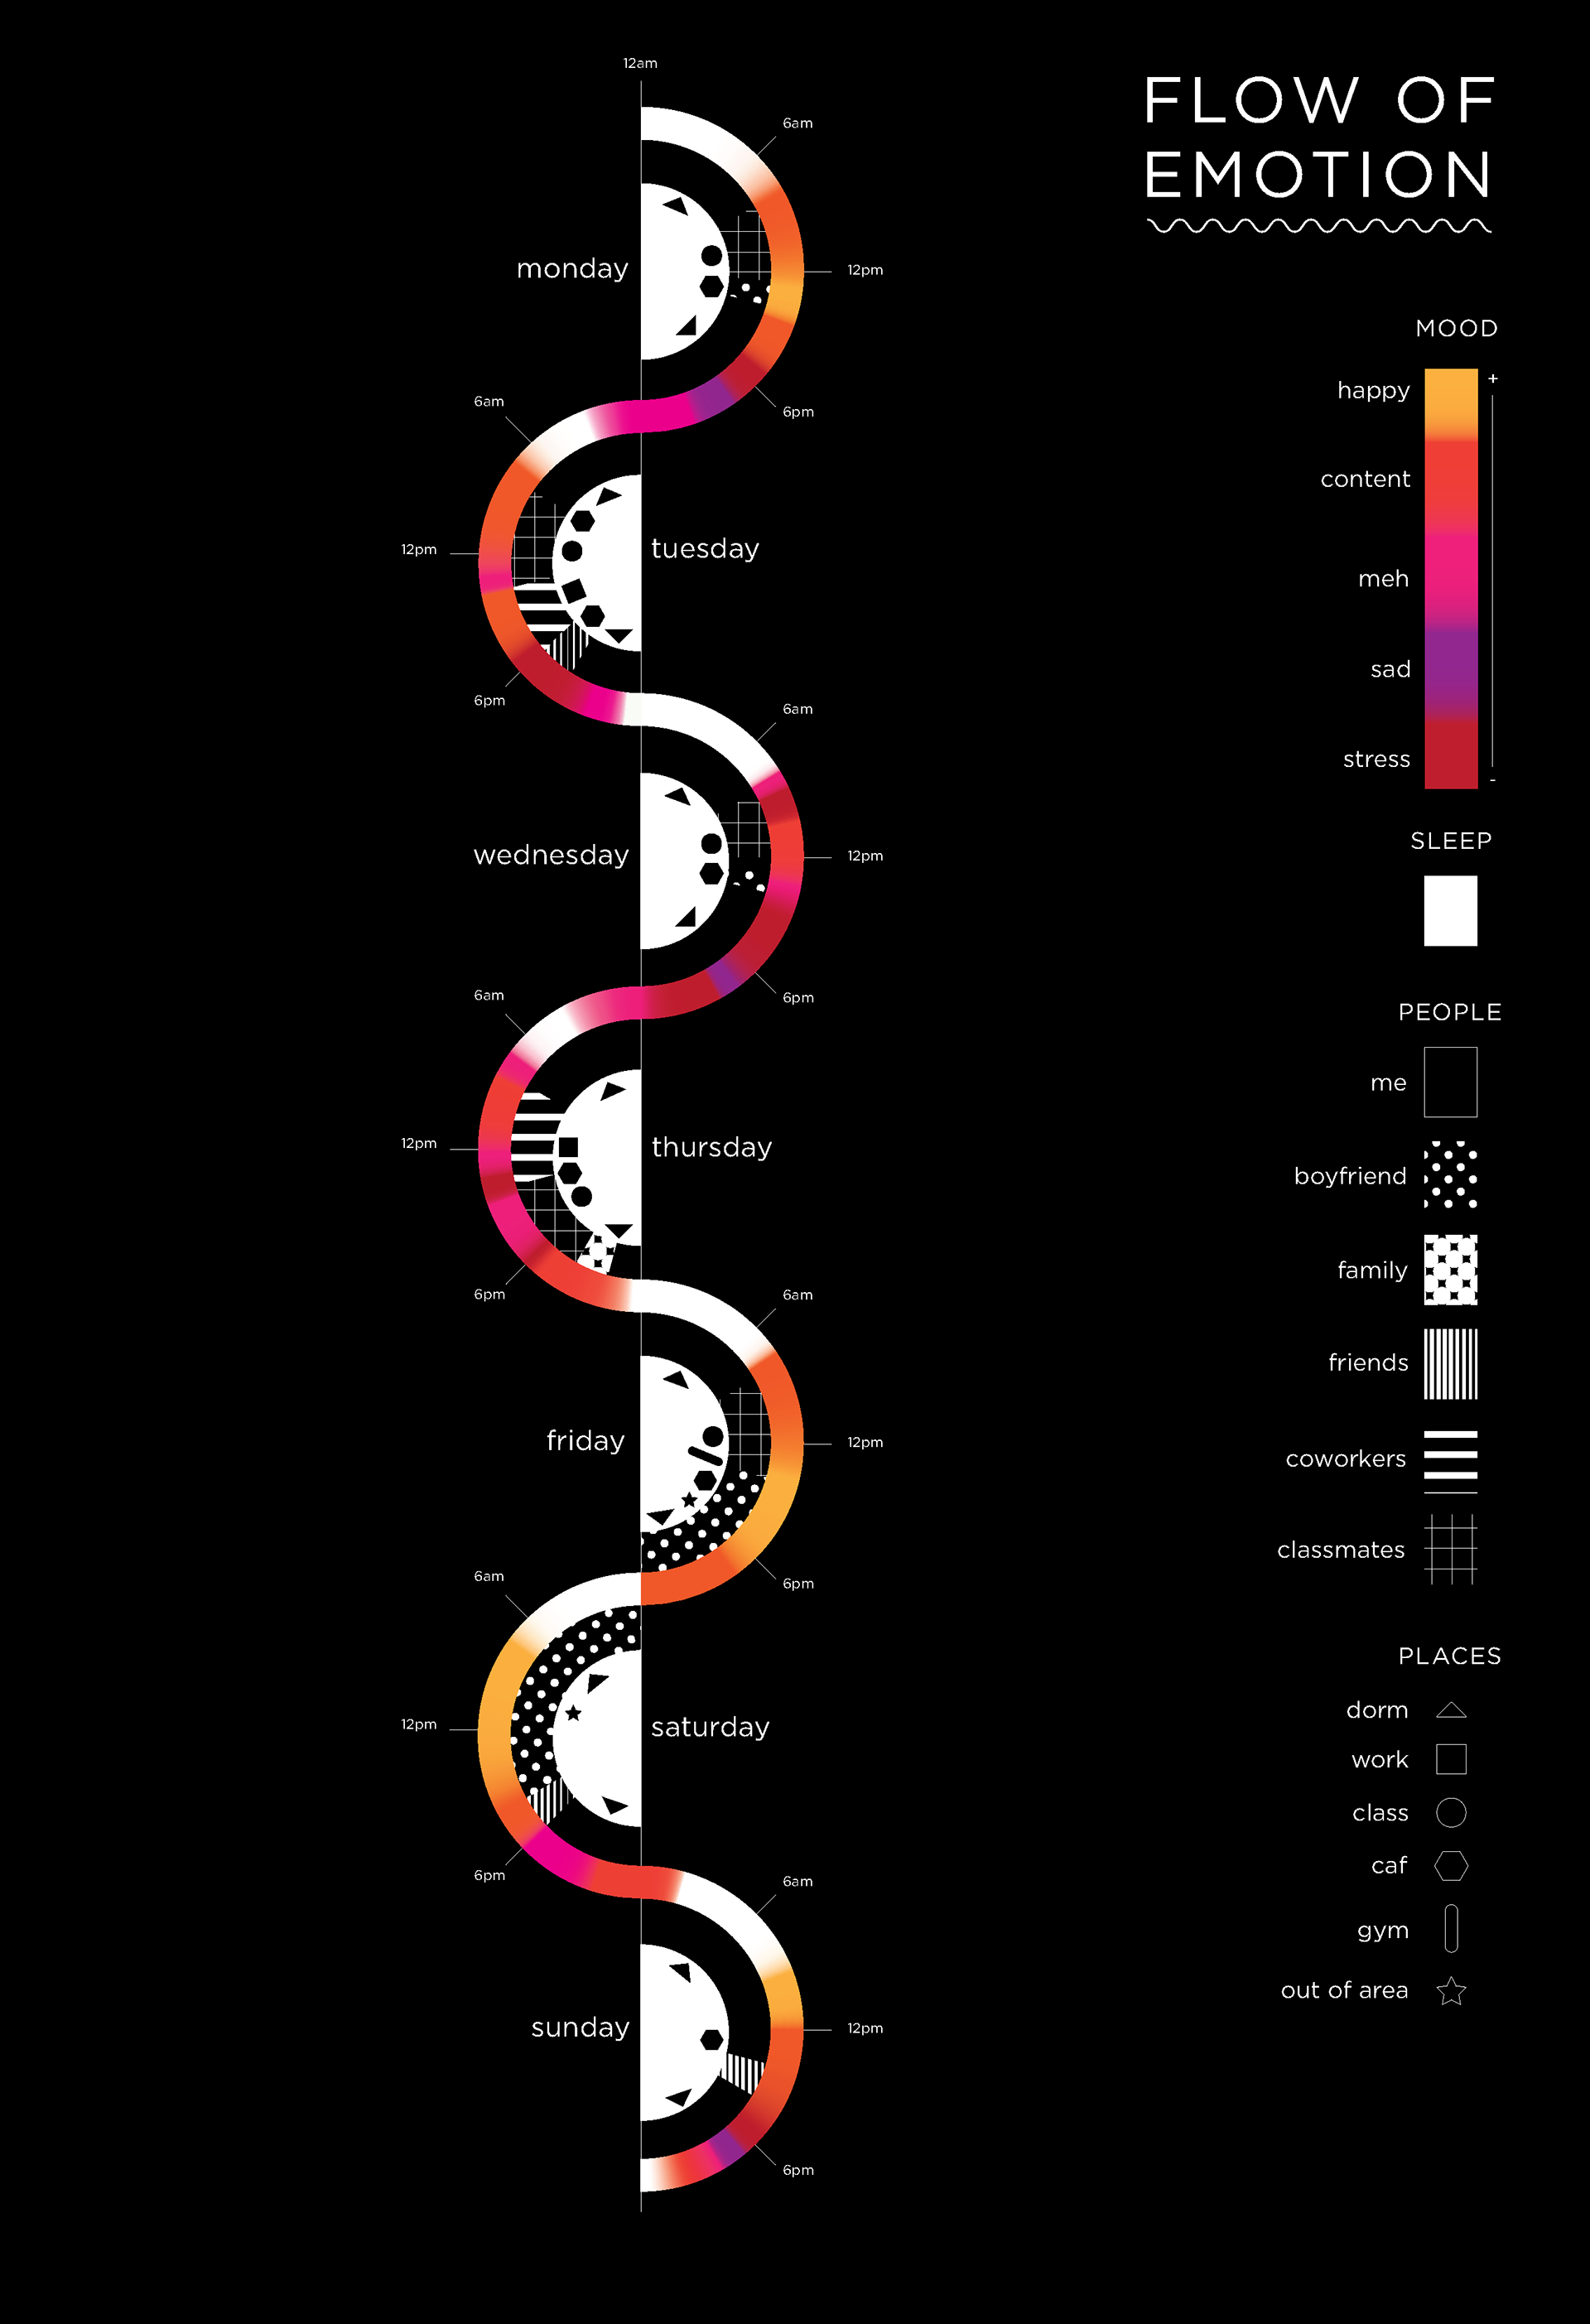
PROCESS — Week Four: Data Mapping
PROCESS — Week Five: Data Mapping
PROCESS — Week Six: Data Mapping
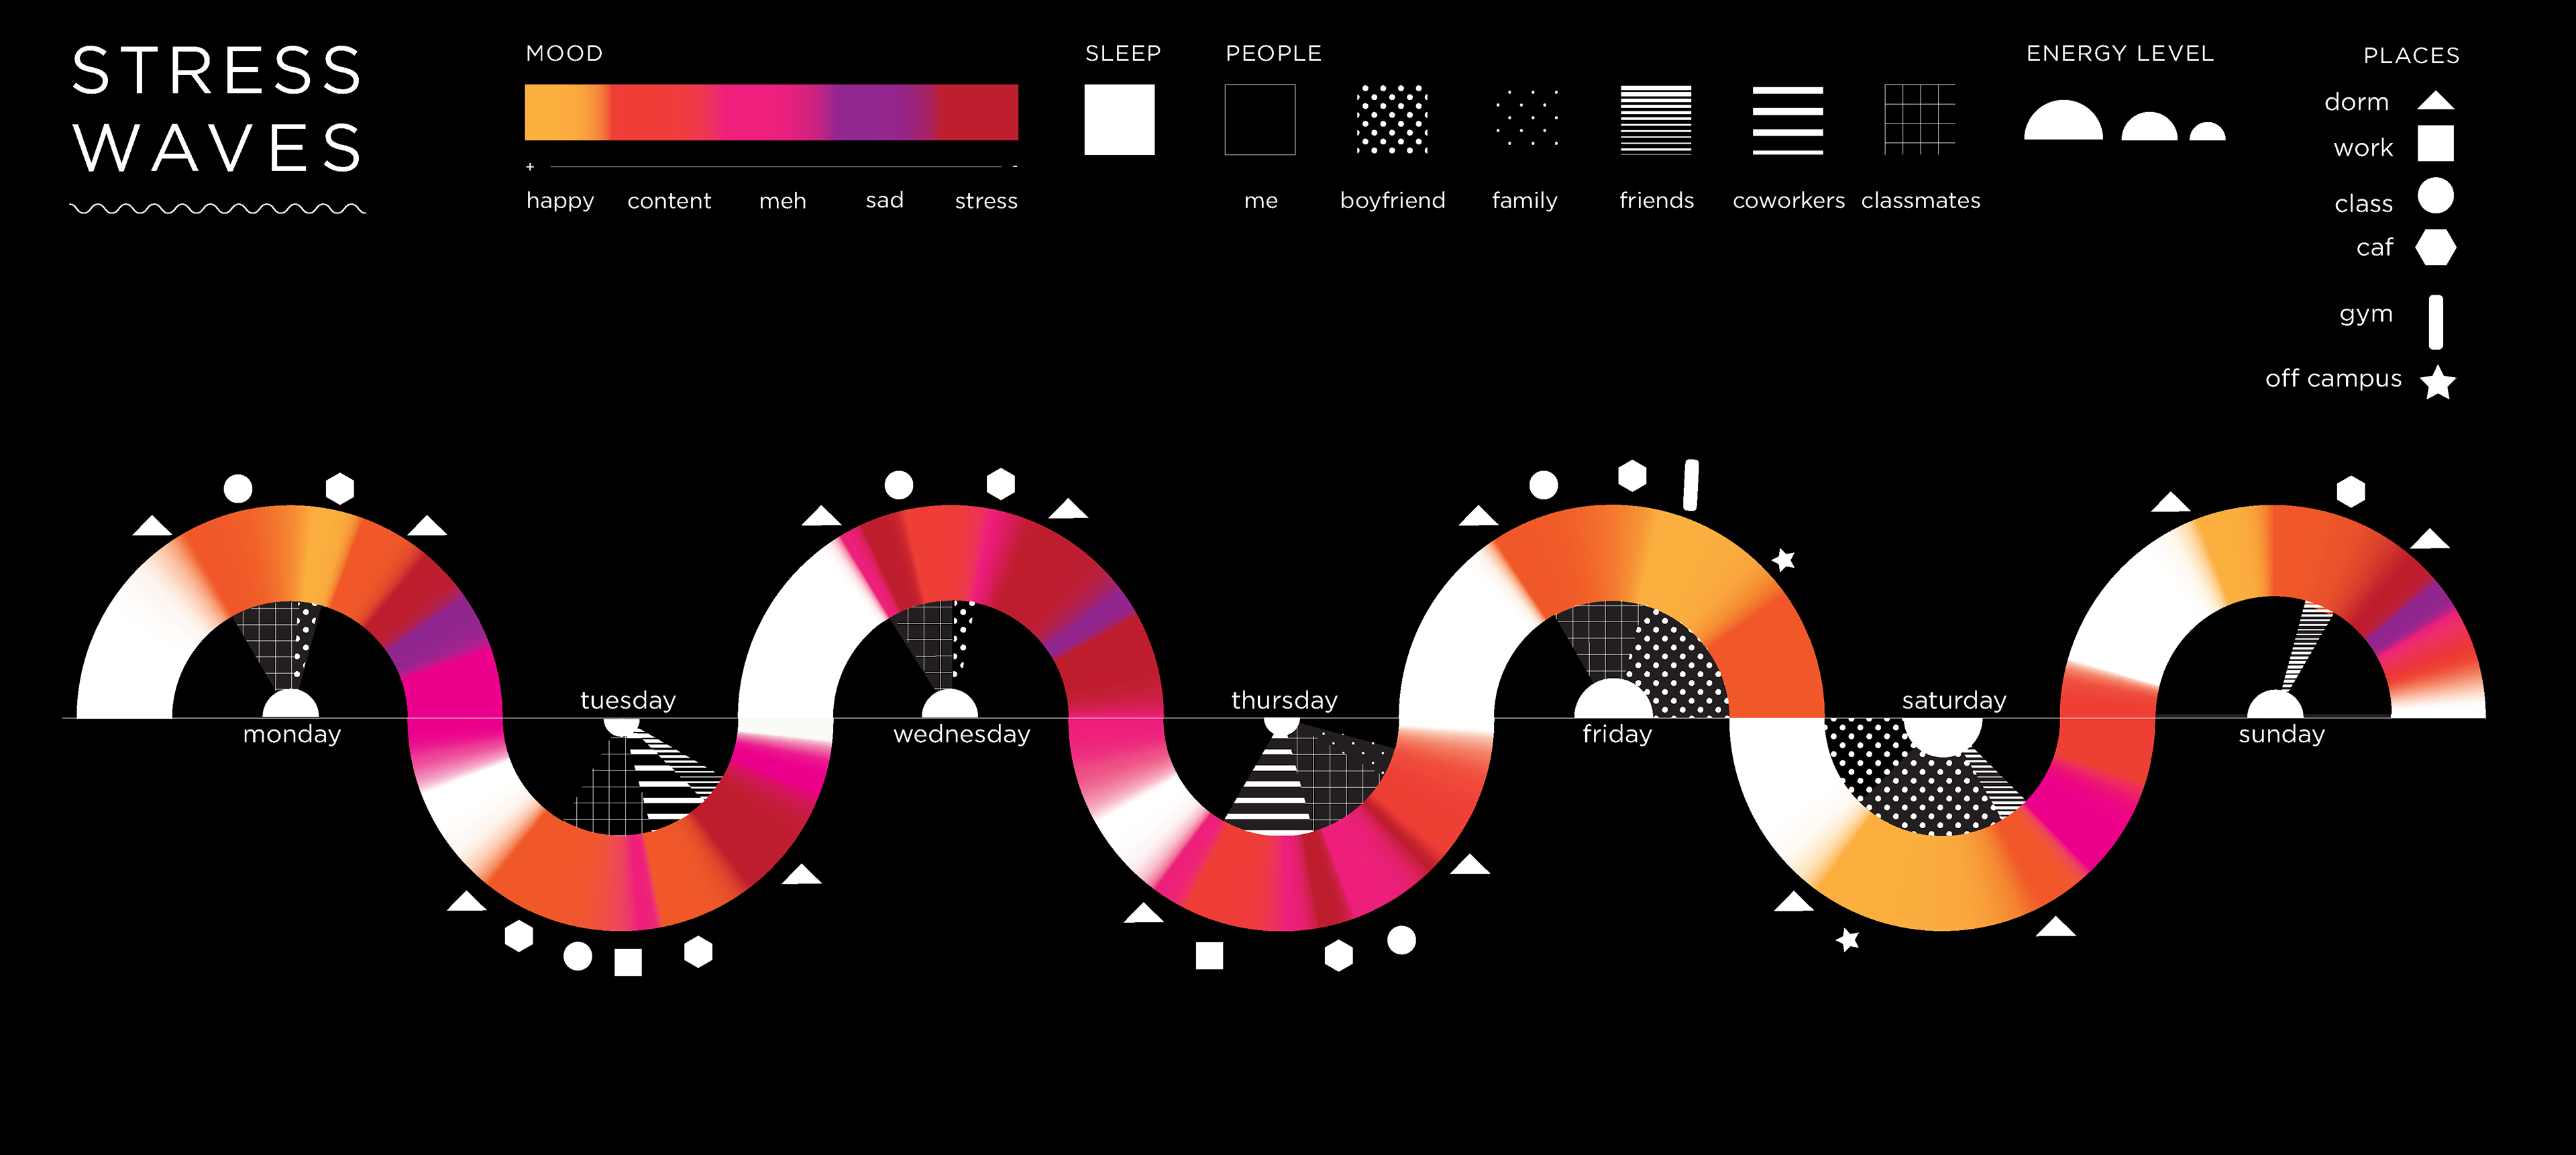
PROCESS — Week Seven: Data Mapping